

Harlow property market November 2026 heating up or cooling down?
Jukes Estate Agents take their regular monthly look at the Harlow property market. Using data from property experts The Advisory (https://www.theadvisory.co.uk/), they look at the the four postcode sectors CM17, CM18, CM19 & CM20. The method is simply. They divide the amount of properties on the market by the amount of properties sold. This gives a percentage of listed property sold. Therefore, we can see if the market is cooling down or heating up.
CM17
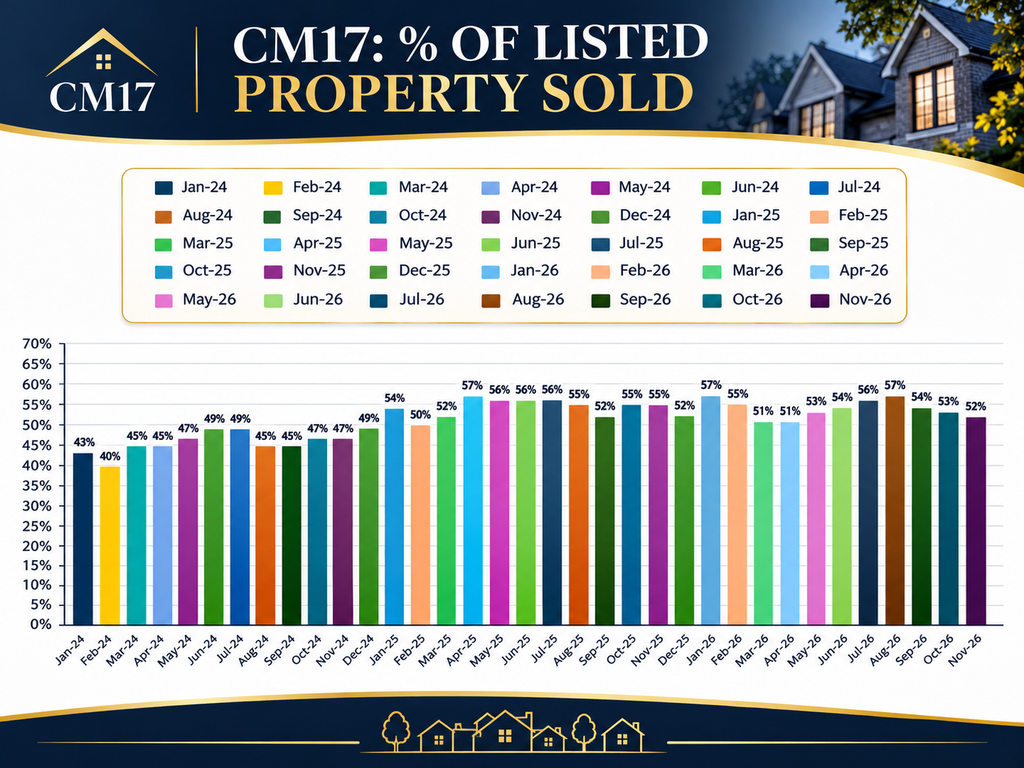
This postcode has cooled down by 1% in the last month. Data sourced from The Advisory (https://www.theadvisory.co.uk/).
When we analyse this postcode we can see the following results since January 2024:
2024:
January 43%, February 39%, March 40%, April 45%, May 45%, June 47%.
July 49%, August 49%, September 45%, October 46%, November 47%, December 49%.
2025:
January 2025 54%, February 2025 50%, March 2025 52%, April 2025 57%, May 2025 56%. June 2025 56%. July 56%. August 55%. September 52%. October 55%. November 53%. December 52%.
2026:
January 2026 57%. February 55%. March 52%. April 51%. May 53%. June 54%. July 56%, August 57%. September 54%. October 53%. November 52%.
CM17 cooled down by 1% this last month. This has ben the third consecutive month that it has dropped!
CM18
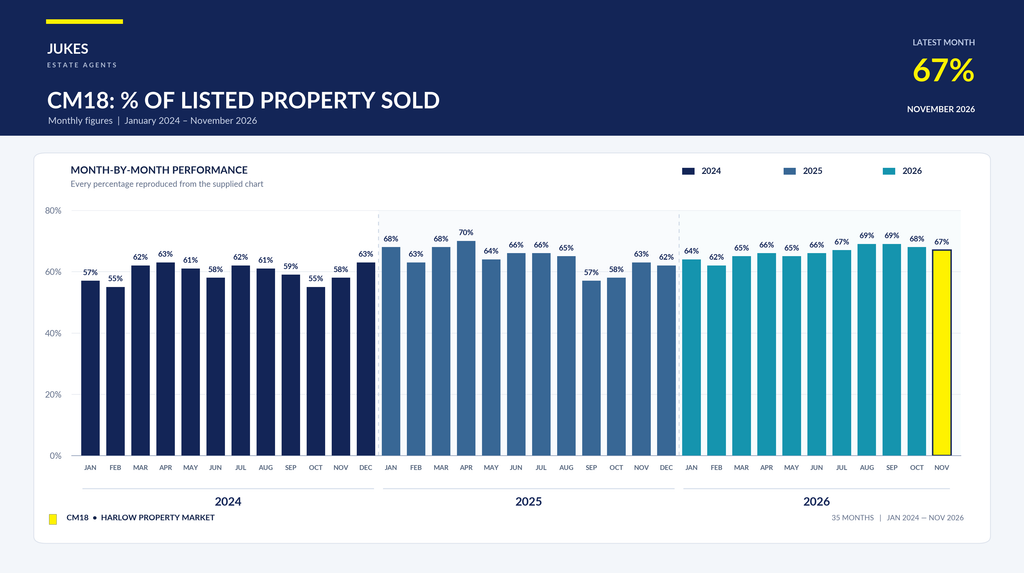
This postcode has dropped by 1% in the last month. Data sourced from The Advisory (https://www.theadvisory.co.uk/).
Let’s look at what this postcode has done since Jan 2024:
2024
January 57%, February 55%, March 62%, April 63%, May 61%, June 58%.
July 62%, August 61%, September 59%, October 55%, November 58%, December 63%.
2025
January 68%, February 63%, March 68%, April 70%, May 64%. June 66%. July 66%. August 65%. September 57%. October 58%. November 63%. December 62%.
2026:
January 2026 64%. February 62%. March 65%. April 66%. May 65%. June 66%. July 67%. August 69%. September 69%. October 68%. November 67%.
This is the second consecutive drop for CM18 although it is the highest performing postcode in Harlow.
CM19
Harlow property market November 2026 heating up or cooling down?
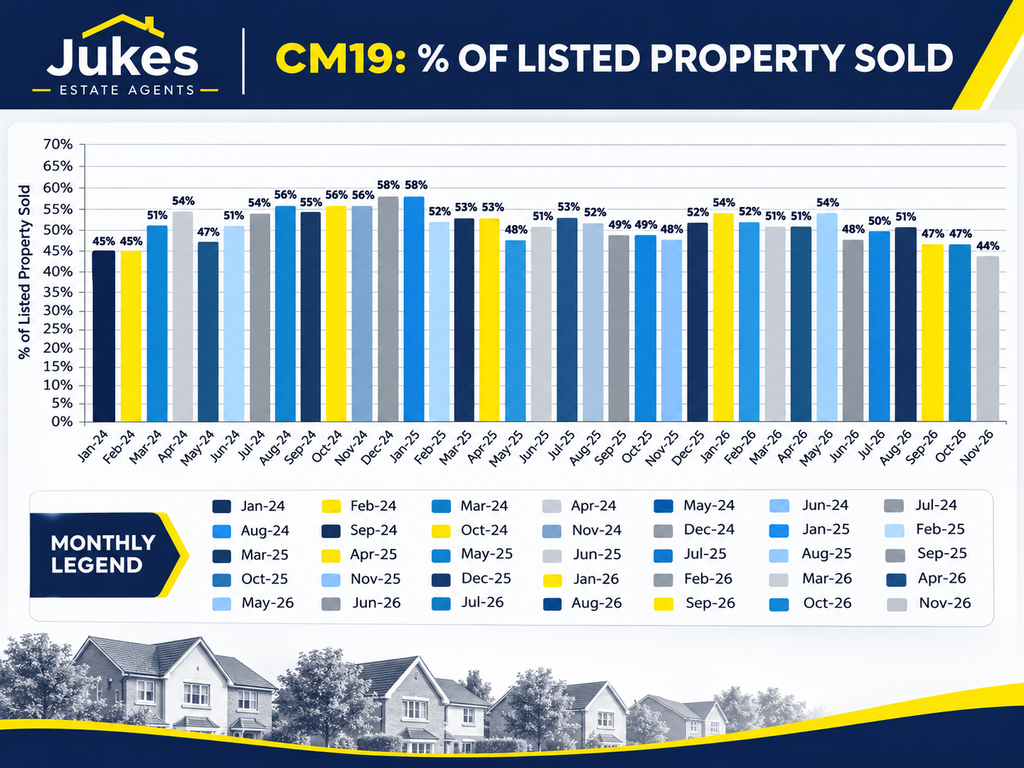
CM19 dropped 3%% this month.
Let’s look at its performance since Jan 2024:
2024
January 45%, February 45%, March 52%, April 51%, May 47%, June 51%.
July 54%, August 56%, September 55%, October 56%, November 56%, December 58%.
2025
January 58%, February 52%, March 53%, April 53%, May 48%. June 51%. July 53%. August 52%. September 49%. October 49%. November 48%. December 53%.
2026:
January 54%. February 52%. March 51%. April 51%. May 54%. June 48%. July 50%. August 51%. September 47%. October 47%. November 44%.
CM19: When you consider that back in January 2025, CM19 was performing at 58%, It is extremely disappointing to see it slide to just 44%. Again though, I believe that this is down to Roydon properties that are far more expensive taking way too long to sell.
CM20
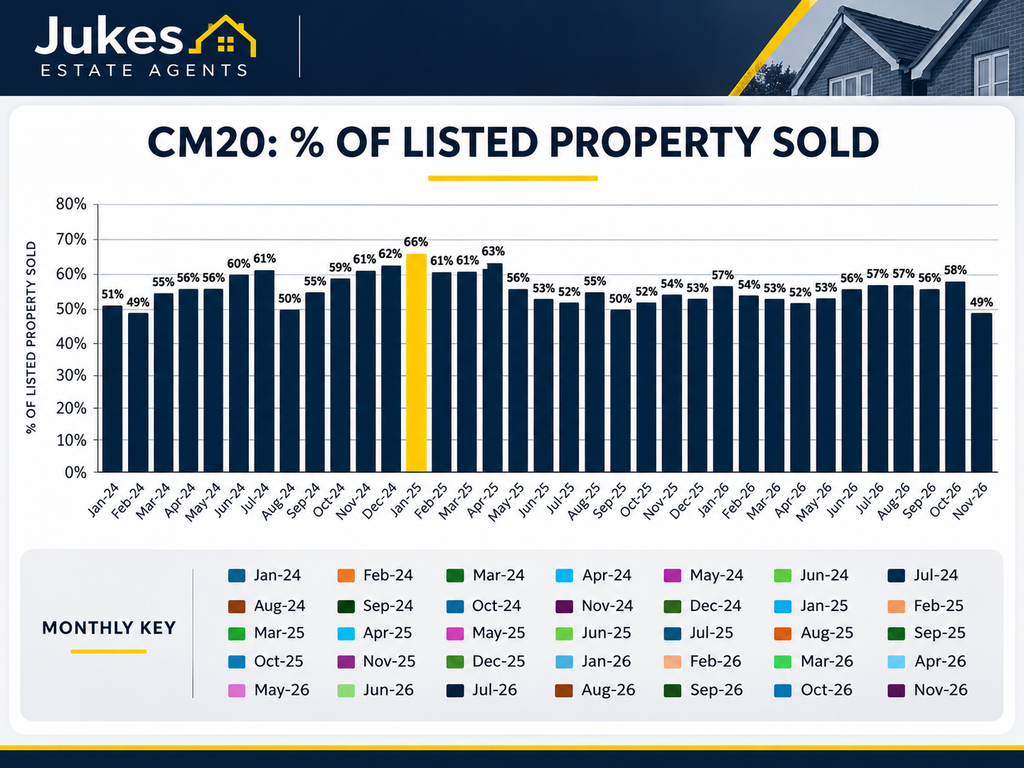
CM20 cooled down by a massive 9% this month!
Let’s look at its performance since Jan 2024:
2024
January 51%, February 49%, March 55%, April 56%, May 56%, June 60%.
July 61%, August 50%, September 55%, October 59%, November 61%, December 62%.
2025
January 66%, February 61%, March 61%, April 63%, May 56%. June 53%. July 52%. August 55%. September 50%. October 52%. November 54%. December 53%.
2026:
January 57%. February 54%. March 53%. April 52%. May 53%. June 56%. July 57%. August 57%. September 56%. October 58%. November 49%
CM20 took a massive hit this month and is now performing at its lowest since Feb 2024.
Conclusion
Harlow dropped 3.5% to 53% which is exactly the national average. It is rare that all four postcodes fell during October which is a month where last year we saw three sectors rise and one stay the same. Whilst we hope this is merely a ‘glitch’ there is concern that it might just be that start of a real slowing on the UK property market.