
CM17 property market overview October 2026
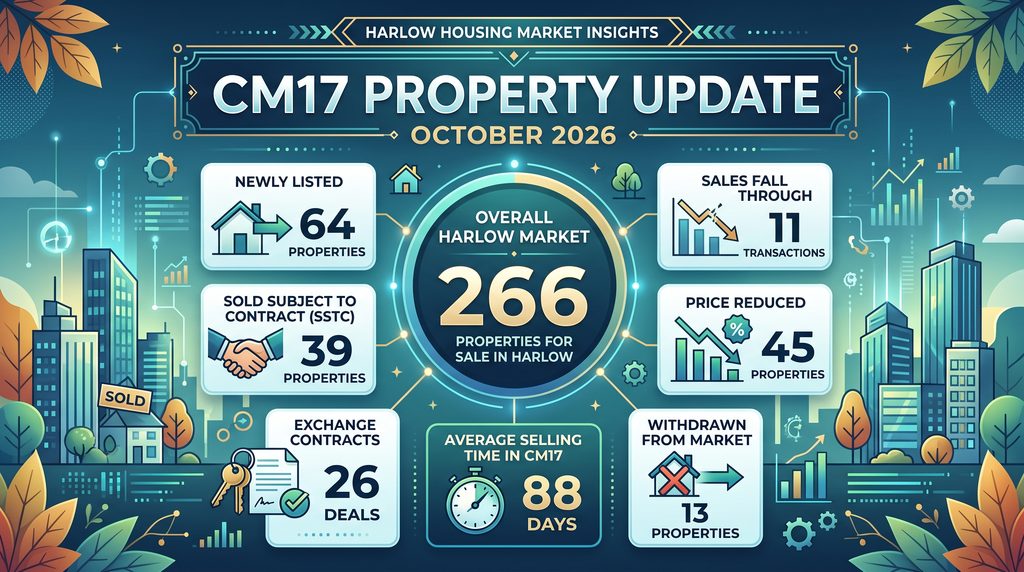
There are currently 266 properties for sale in CM17.
39 properties where sold subject to contract (STTC) last month.
64 new properties were listed last month.
The average selling time for CM17 property was 88 days.
26 properties exchanged contracts.
11 sales fell through.
45 properties had their sale price reduced.
13 have been withdrawn from the market.
Data supplied by TwentyEA (https://apps.twentyea.co.uk/).
Breakdown of new instructions this month by price band
There were 64 new instructions in CM17 in the last month.
| PROPERTY PRICE BAND | NUMBER OF PROPERTIES |
| £50,000 – £100,000 | 1 |
| £100,000 – £150,000 | 1 |
| £150,000 – £200,000 | 1 |
| £200,000 – £250,000 | 4 |
| £250,000 – £300,000 | 8 |
| £300,000 – £350,000 | 8 |
| £350,000 – £400,000 | 4 |
| £400,000 – £500,000 | 17 |
| £500,000 – £600,000 | 9 |
| £600,000 – £750,000 | 3 |
| £750,000 – £1,000,000 | 7 |
| £1,000,000 – £2,000,000 | 1 |
| £2,000,000 – £3,000,000 | 0 |
Breakdown of SSTC this month by price band
39 Properties SSTC in CM17 in the last month.
| PROPERTY PRICE BAND | NUMBER OF PROPERTIES |
| £50,000 – £100,000 | 0 |
| £100,000 – £150,000 | 1 |
| £150,000 – £200,000 | 2 |
| £200,000 – £250,000 | 3 |
| £250,000 – £300,000 | 5 |
| £300,000 – £350,000 | 6 |
| £350,000 – £400,000 | 6 |
| £400,000 – £500,000 | 7 |
| £500,000 – £600,000 | 5 |
| £600,000 – £750,000 | 4 |
| £750,000 – £1,000,000 | 0 |
| £1,000,000 – £2,000,000 | 0 |
| £2,000,000 – £3,000,000 | 0 |
Breakdown of properties that have exchanged this month by price band
26 properties have exchanged in CM17 in the last month.
| PROPERTY PRICE BAND | NUMBER OF PROPERTIES |
| £50,000 – £100,000 | 1 |
| £100,000 – £150,000 | 0 |
| £150,000 – £200,000 | 1 |
| £200,000 – £250,000 | 1 |
| £250,000 – £300,000 | 2 |
| £300,000 – £350,000 | 8 |
| £350,000 – £400,000 | 4 |
| £400,000 – £500,000 | 3 |
| £500,000 – £600,000 | 2 |
| £600,000 – £750,000 | 2 |
| £750,000 – £1,000,000 | 2 |
| £1,000,000 – £2,000,000 | 0 |
| £2,000,000 – £3,000,000 | 0 |
Breakdown of properties whose sales fell through in the last month.
11 Properties saw their sale fall through.
| PROPERTY PRICE BAND | NUMBER OF PROPERTIES |
| £50,000 – £100,000 | 0 |
| £100,000 – £150,000 | 0 |
| £150,000 – £200,000 | 0 |
| £200,000 – £250,000 | 1 |
| £250,000 – £300,000 | 1 |
| £300,000 – £350,000 | 1 |
| £350,000 – £400,000 | 1 |
| £400,000 – £500,000 | 2 |
| £500,000 – £600,000 | 2 |
| £600,000 – £750,000 | 2 |
| £750,000 – £1,000,000 | 1 |
| £1,000,000 – £2,000,000 | 0 |
| £2,000,000 – £3,000,000 | 0 |
Breakdown of properties that had a price reduction in the last month.
45 properties have seen their sale price reduced.
| PROPERTY PRICE BAND | NUMBER OF PROPERTIES |
| £50,000 – £100,000 | 0 |
| £100,000 – £150,000 | 0 |
| £150,000 – £200,000 | 1 |
| £200,000 – £250,000 | 5 |
| £250,000 – £300,000 | 4 |
| £300,000 – £350,000 | 5 |
| £350,000 – £400,000 | 5 |
| £400,000 – £500,000 | 9 |
| £500,000 – £600,000 | 6 |
| £600,000 – £750,000 | 8 |
| £750,000 – £1,000,000 | 1 |
| £1,000,000 – £2,000,000 | 1 |
| £2,000,000 – £3,000,000 | 0 |
Breakdown of properties withdrawn from the market in the last month.
13 properties were withdrawn from the market.
| PROPERTY PRICE BAND | NUMBER OF PROPERTIES |
| £50,000 – £100,000 | 1 |
| £100,000 – £150,000 | 0 |
| £150,000 – £200,000 | 1 |
| £200,000 – £250,000 | 2 |
| £250,000 – £300,000 | 3 |
| £300,000 – £350,000 | 0 |
| £350,000 – £400,000 | 0 |
| £400,000 – £500,000 | 2 |
| £500,000 – £600,000 | 2 |
| £600,000 – £750,000 | 2 |
| £750,000 – £1,000,000 | 0 |
| £1,000,000 – £2,000,000 | 0 |
| £2,000,000 – £3,000,000 | 0 |